Case Study Details Page
Welcome to my Case Study!
Case Study: Interactive Map
This interactive map allows for scrolling interaction and mimics the real life action of zooming in and out of a map. However, what's really happening is dimensional calculation that takes advantage of the map's vector based formatting. By simply adjusting values behind the scenes, the user can feel like they are moving with the map and travelling across Ontario.
This case study was based on this website's idea: https://www.mapchart.net/world.html
During my research of how other websites create interactive maps, I discovered that I have been misinterpreting how a map becomes "interactive" to the user. I was originally under the impression that I needed to incorporate some kind of unique software that has pre-built functionality similar to some kind of Google Maps API. However, upon some dev tools discoveries, I realized that it's as simple as manipulating the vector based map file rather than relying on an entirely separate software.
The end result of this project is a fully scrollable and interactive map that is able to mimic the physicality of viewing a map as well as reaching new limits of JavaScript manipulation of the SVG map file. This control and attention to detail allows for advanced control and integration of GSAP libraries like ScrollTrigger and DrawSVG.
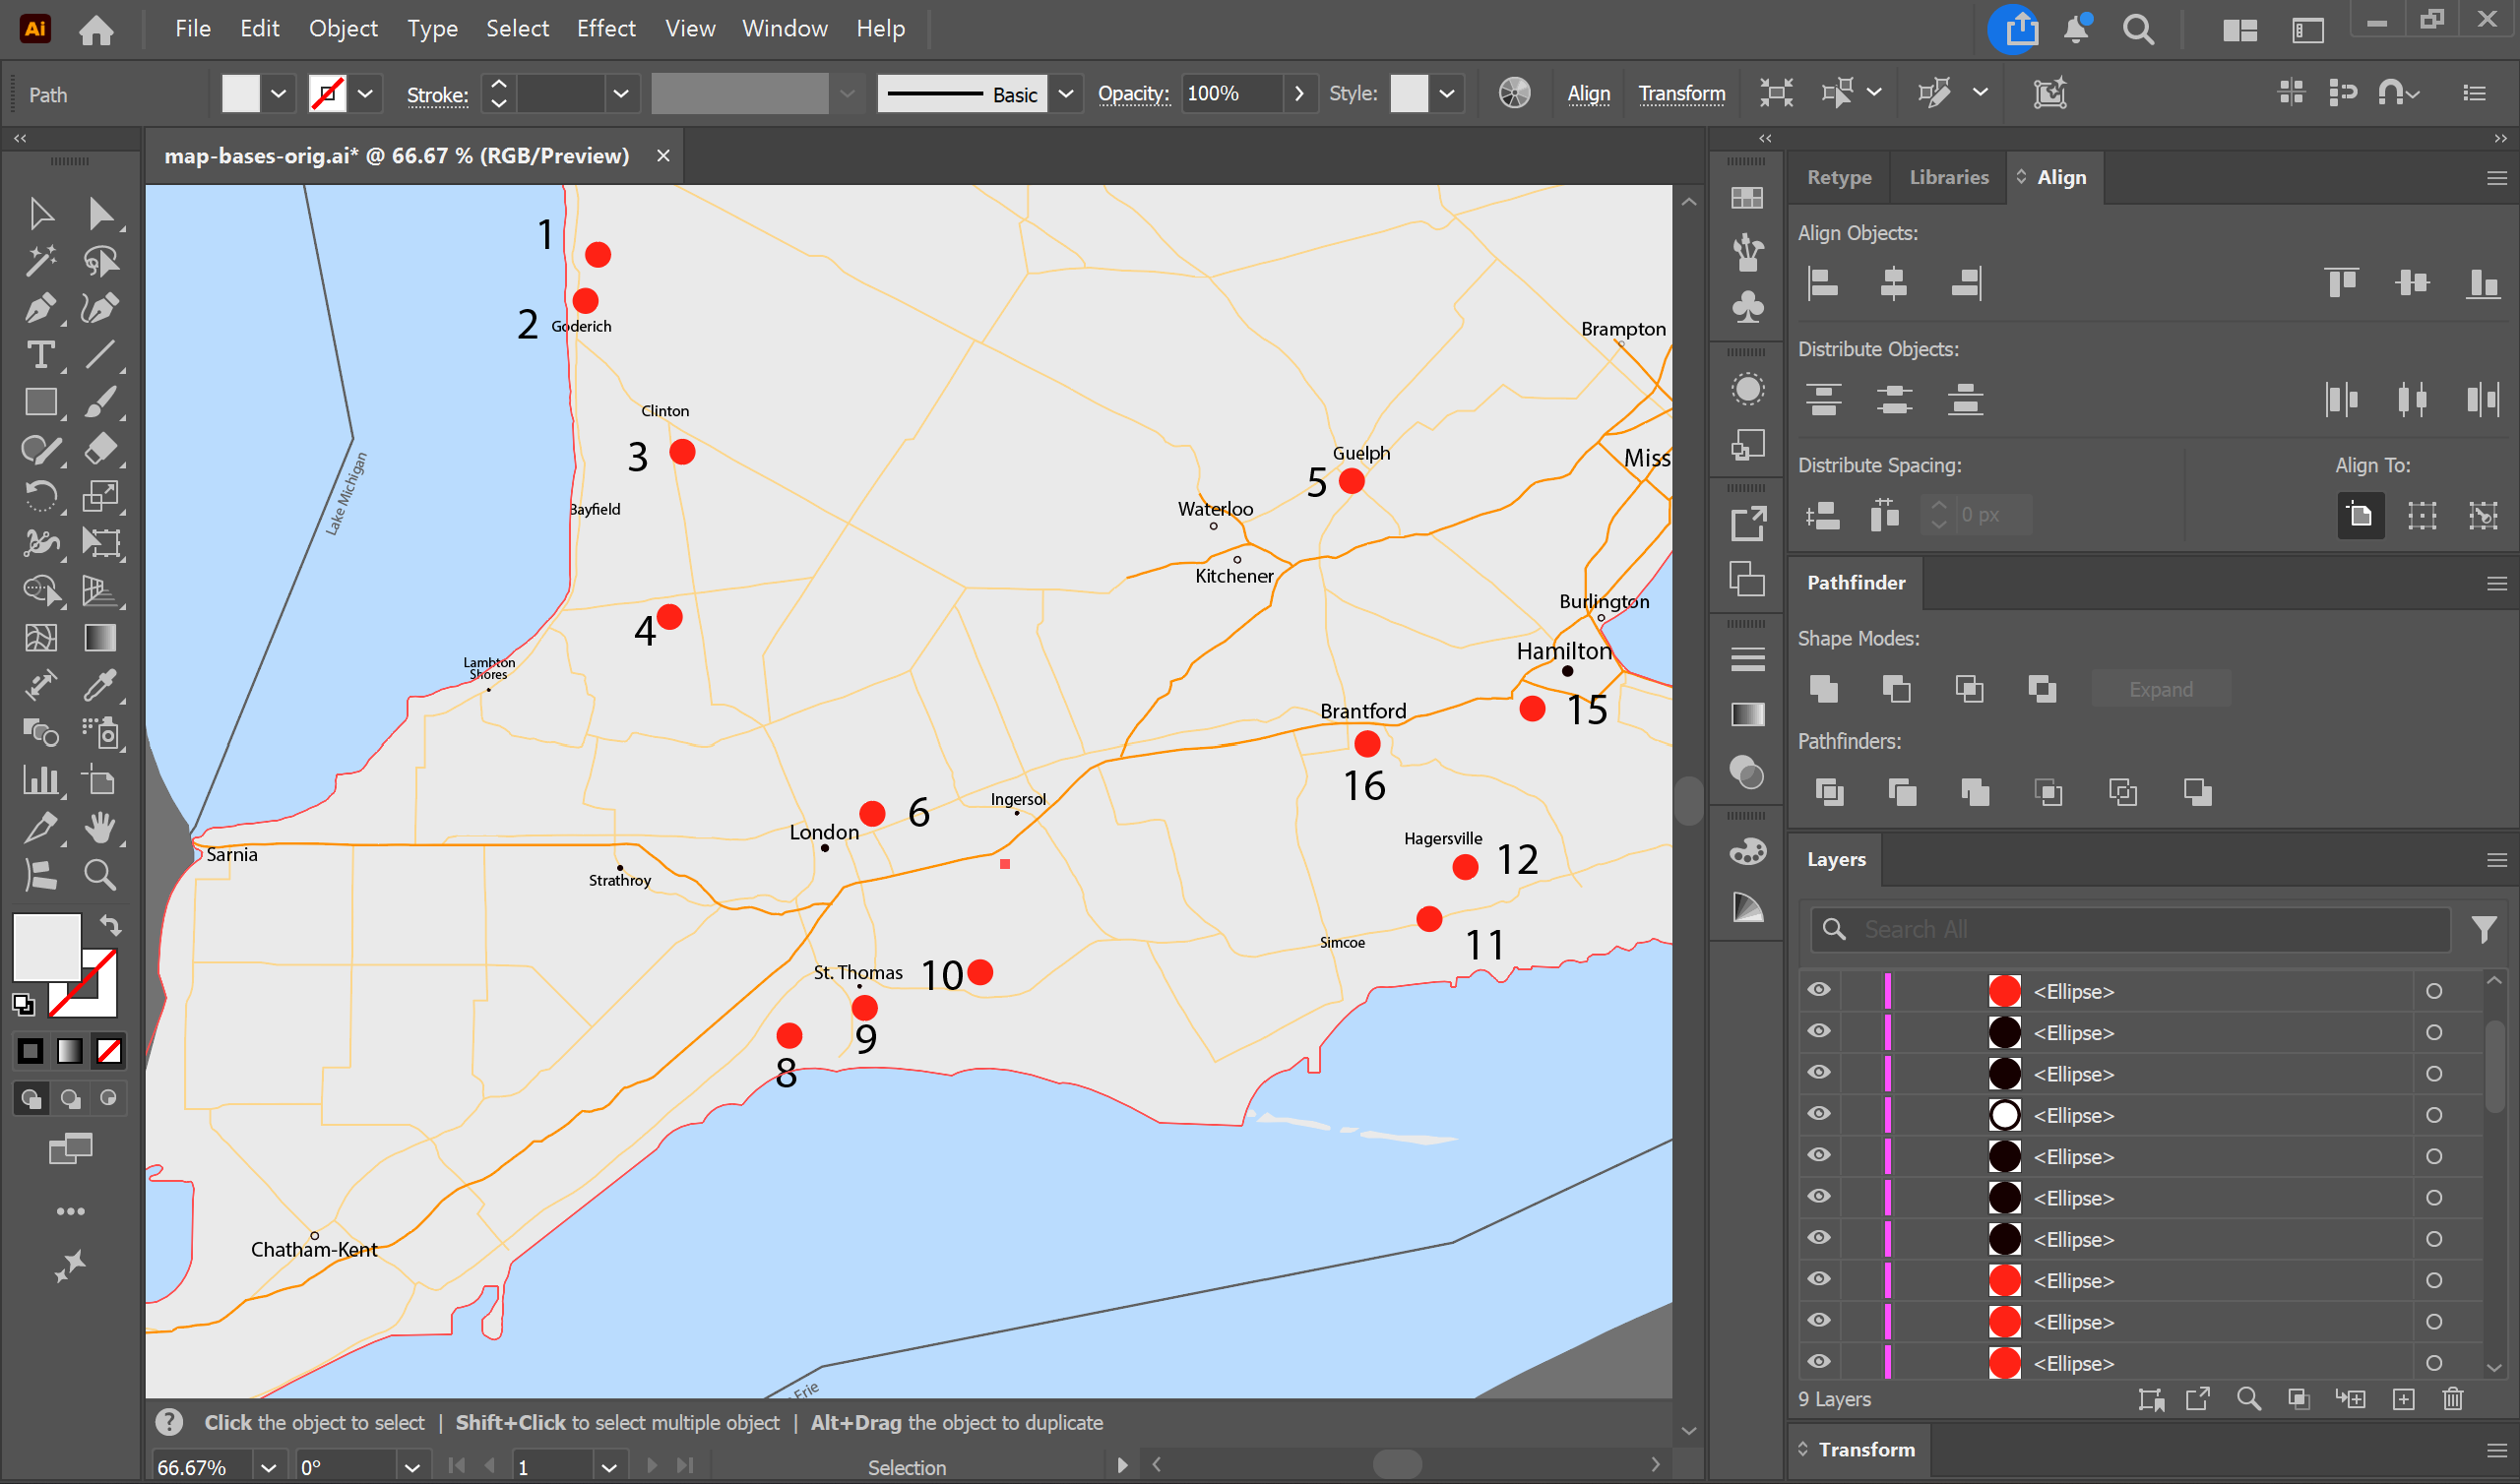
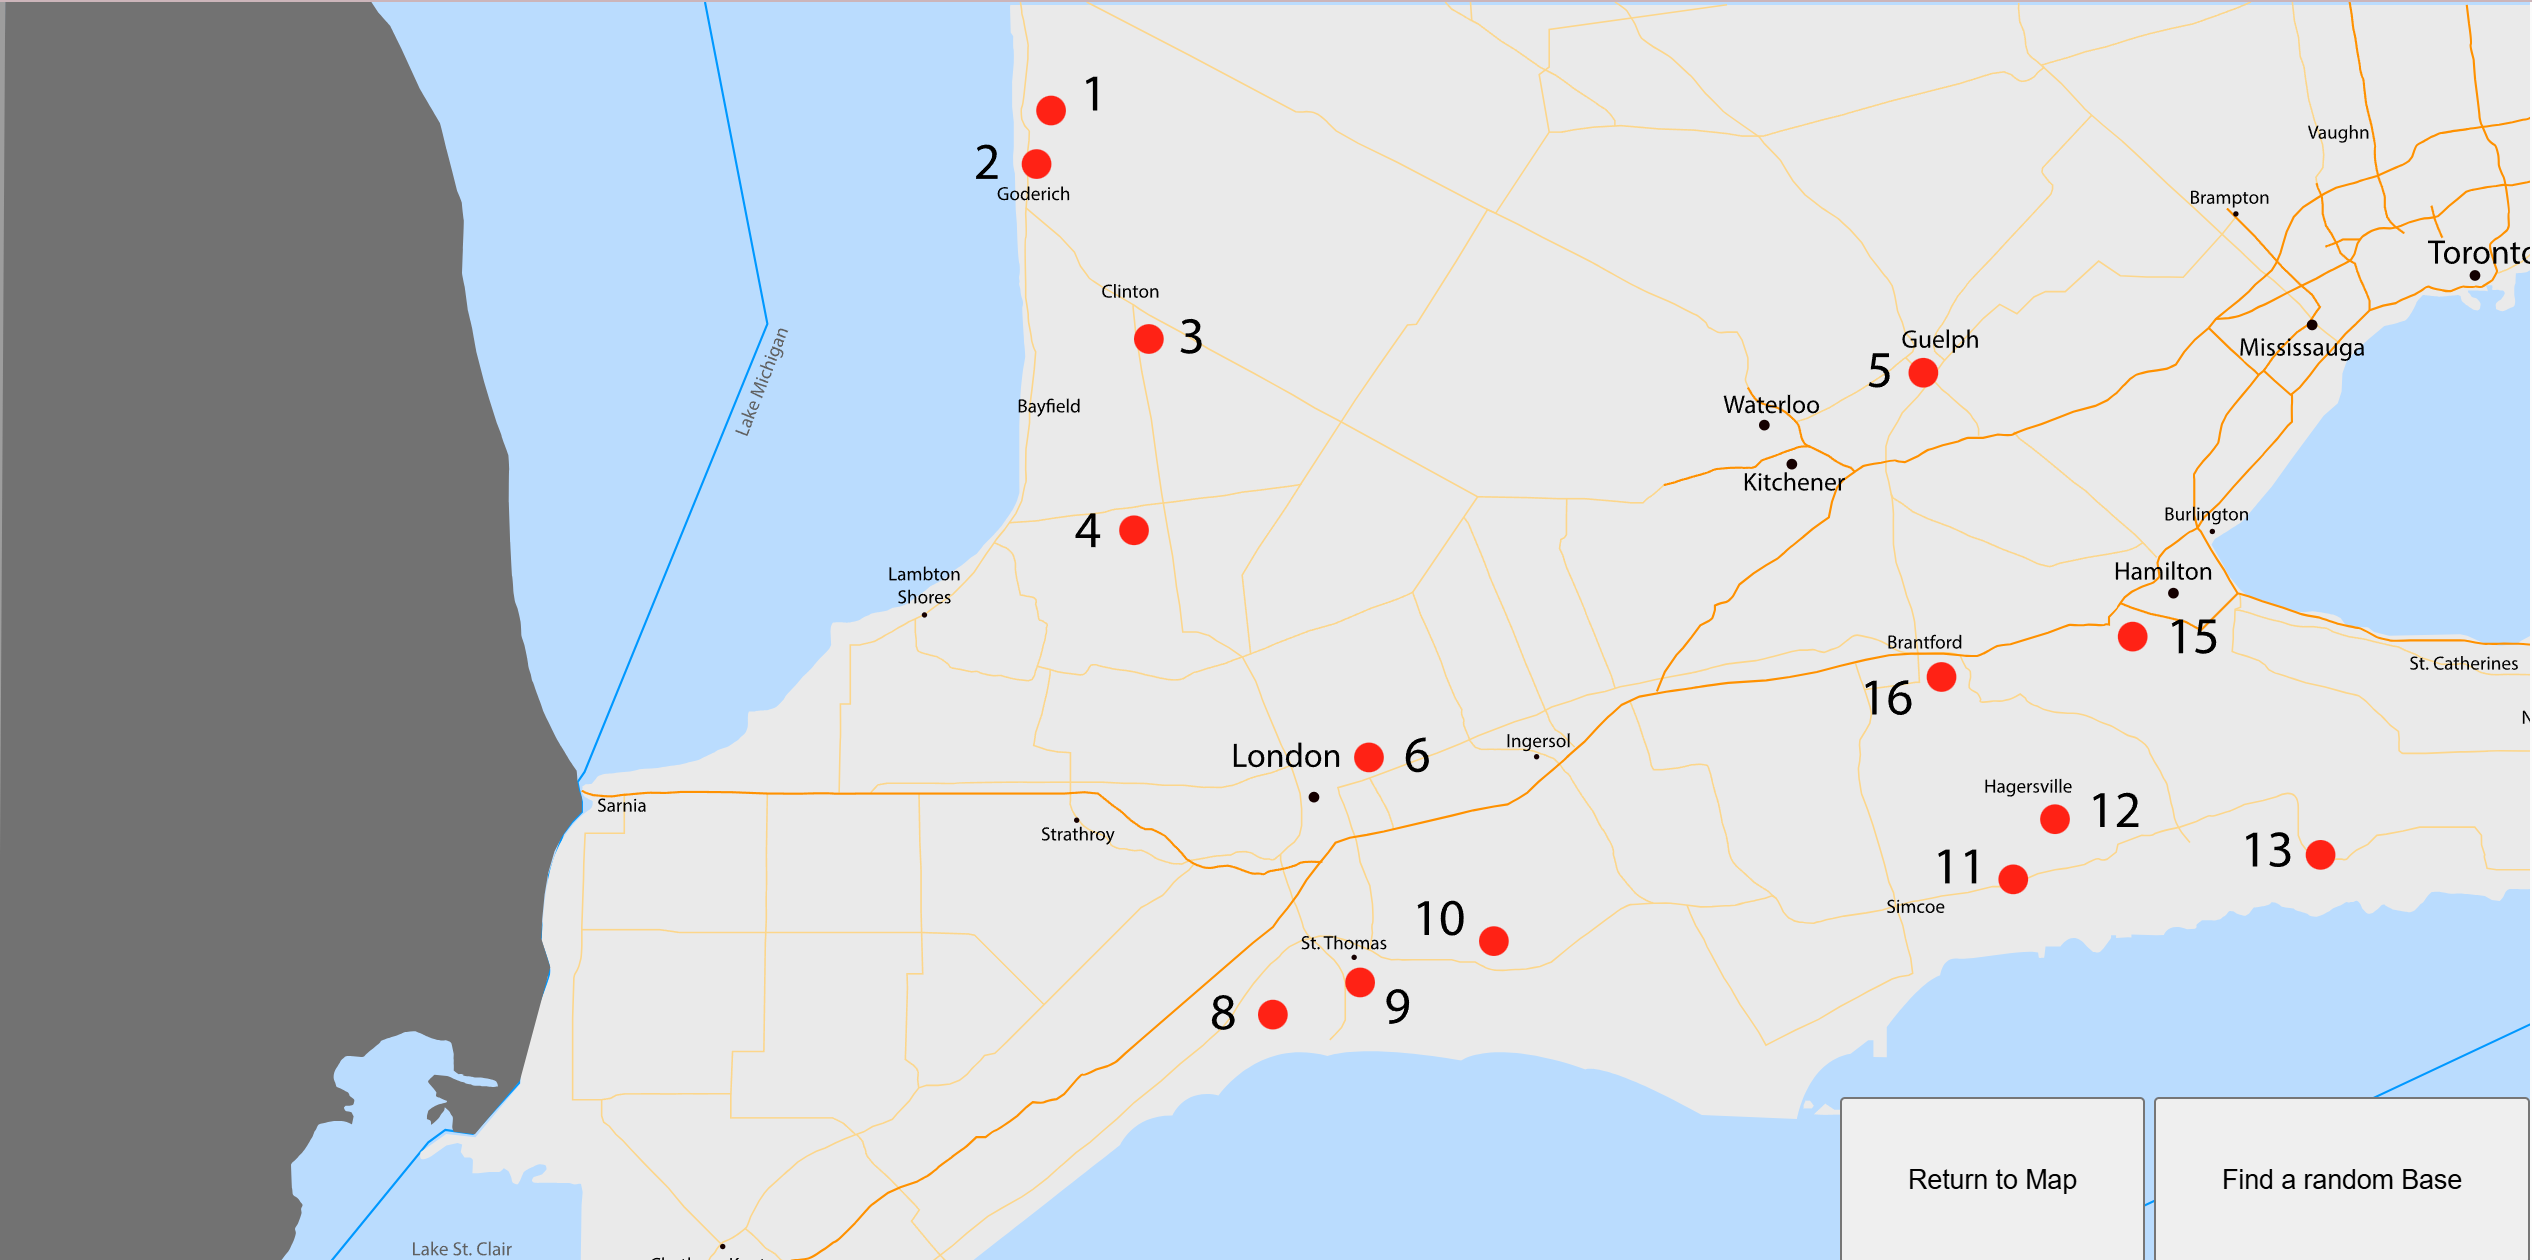
The problem that I initially ran into was visualizing the solution to creating the map. What I was given was a JPG of a general map of Ontario that had various positions in place. The first stage of the problem was to figure out a way to replicate the JPG into a vector format. We opted to trace a lowered opacity version of this JPG to so that we can mimic the shapes and vectors of the lake and city lines of the map.
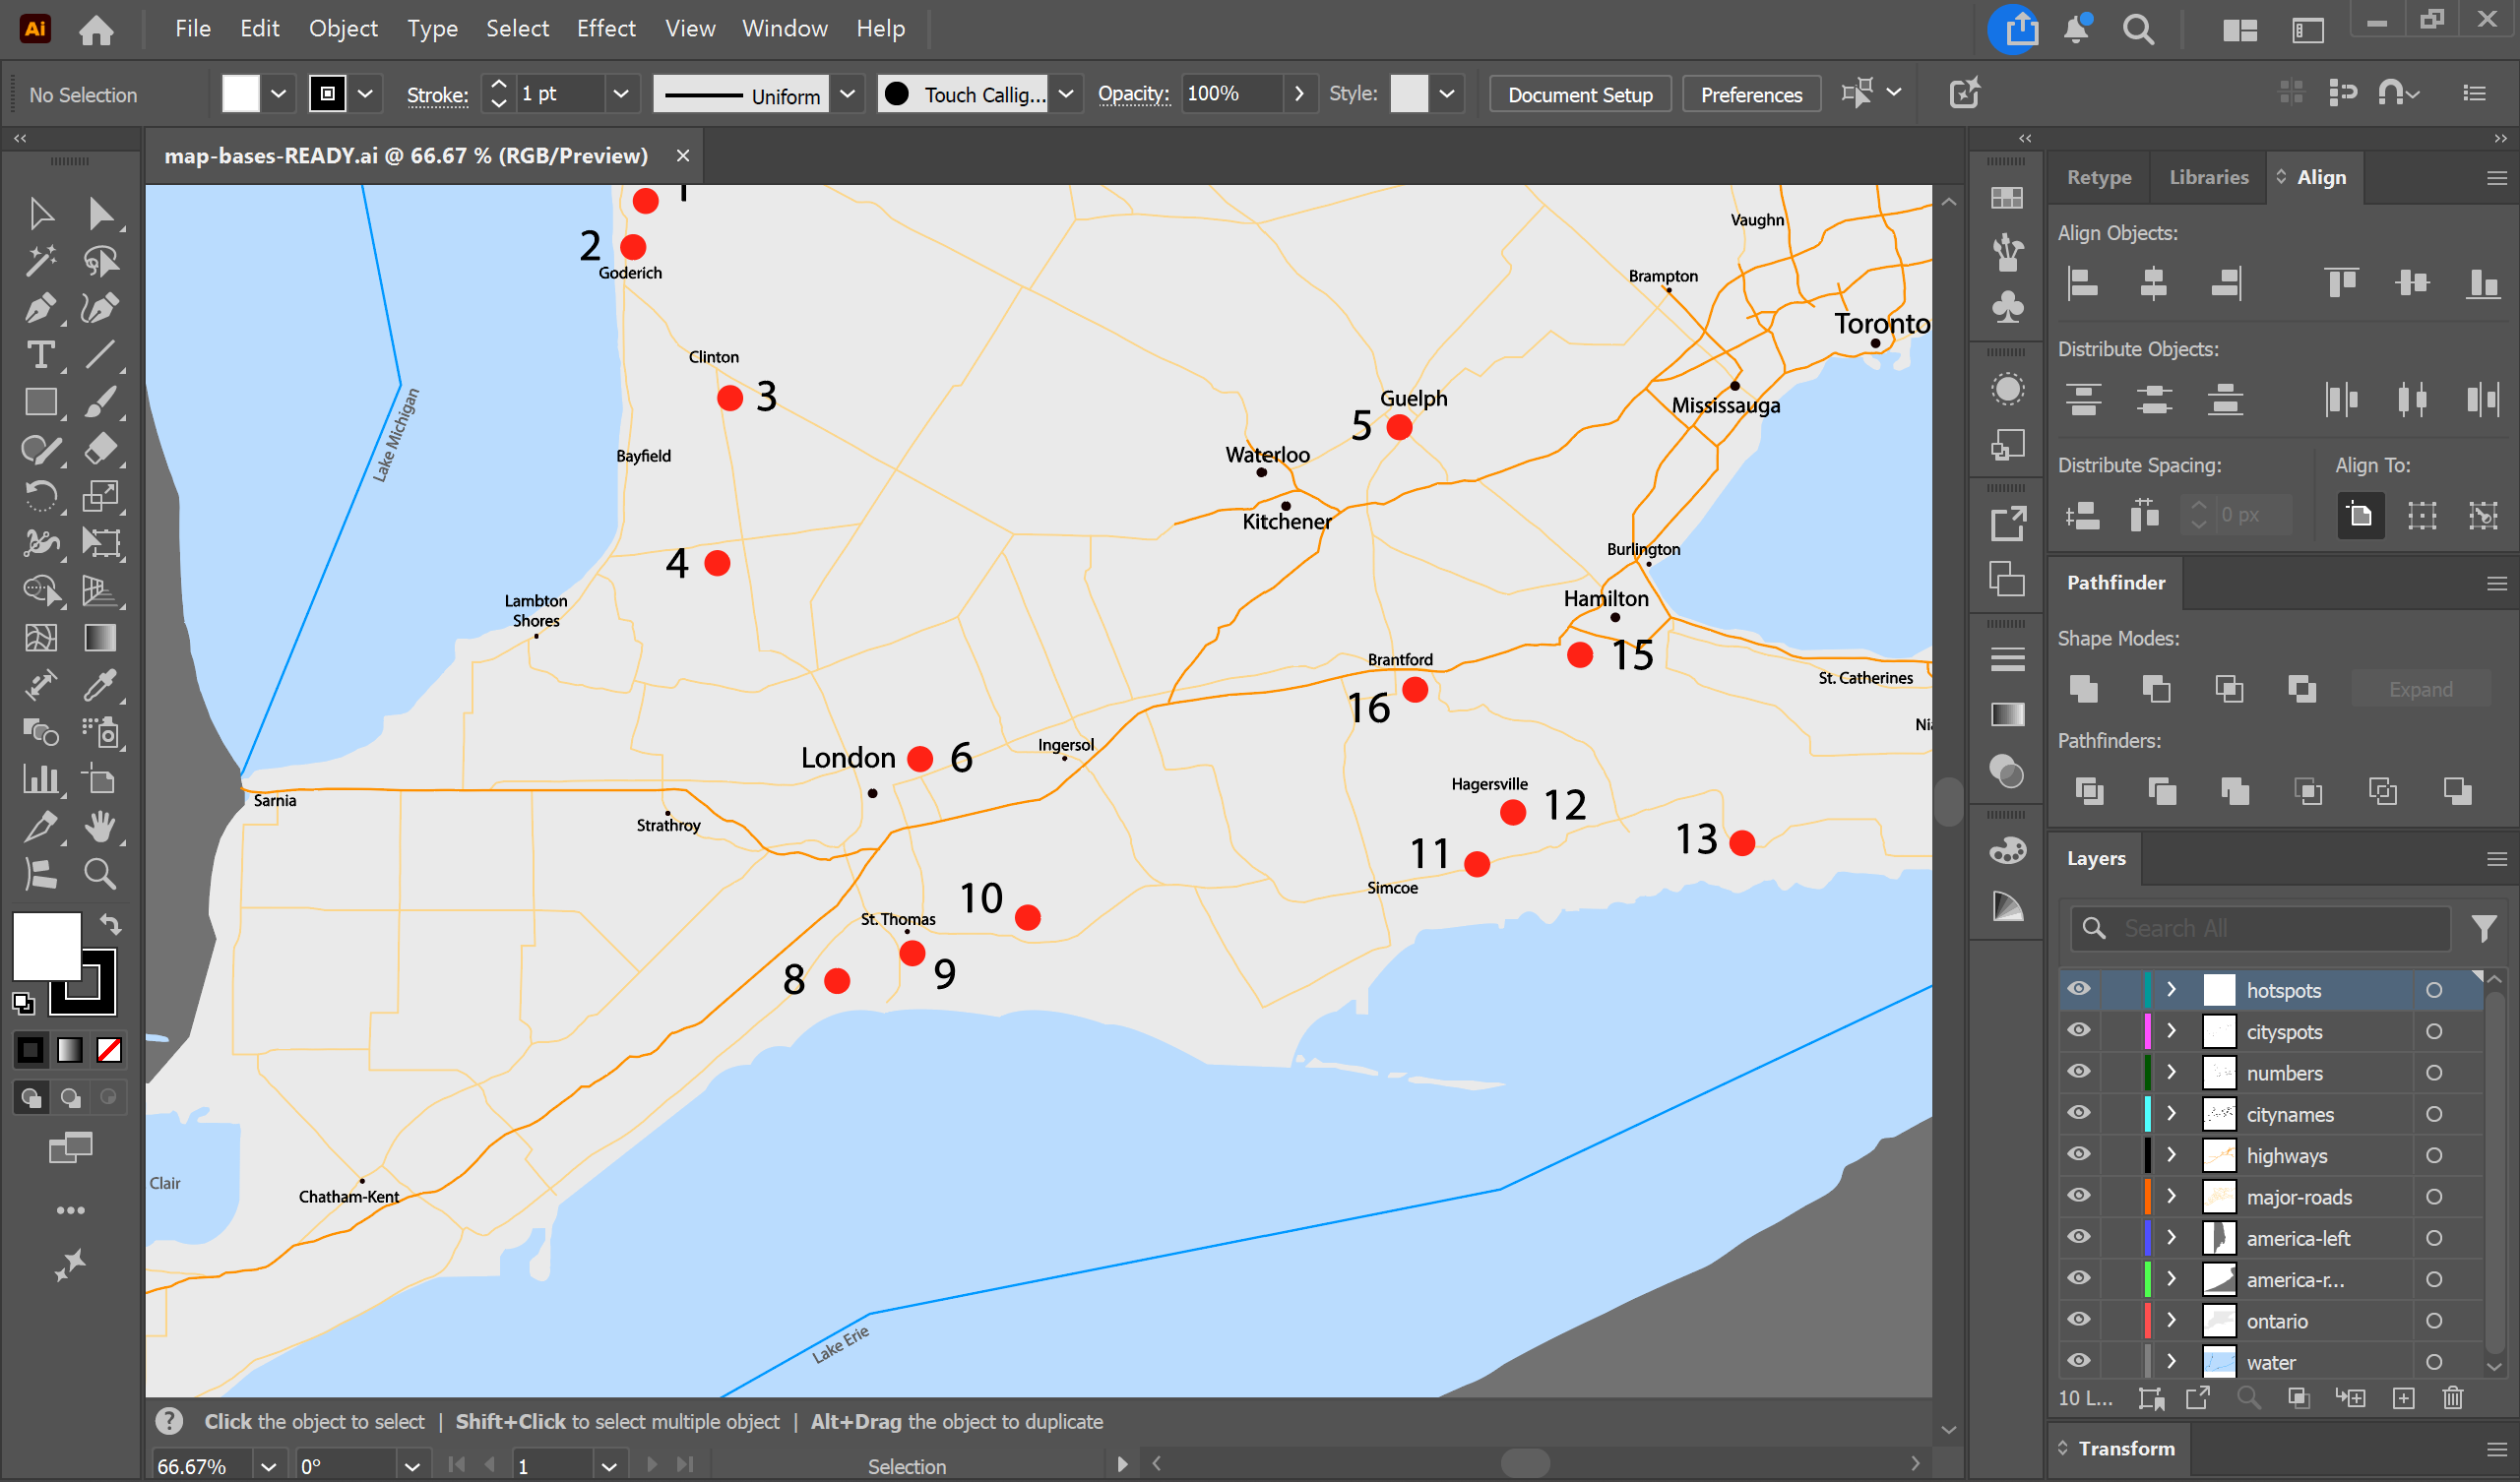
After this was accomplished, we discovered another problem. The paths and shapes of the file were not consistent or properly organized. They were generally categorized and also had inconsistent radii values. Additionally, the text of the various cities also had non-uniform font-sizing and were also not vectorized. This involved a quite painstaking and meticulous process of vectorizing, naming, and organizing each layer and shape individually until master control and congruency was reached.